ECSx Kanban Simulator: Observability
In the last blog post in this series, we saw the taiichi application emitting a log message - a heartbeat - once a second. In this brief post, we'll take a bit of a diversion to set up the ECSx dashboard page in the web application.
First, let's look at what you get when you run a phoenix application and open http://localhost:4000/ in your web browser:
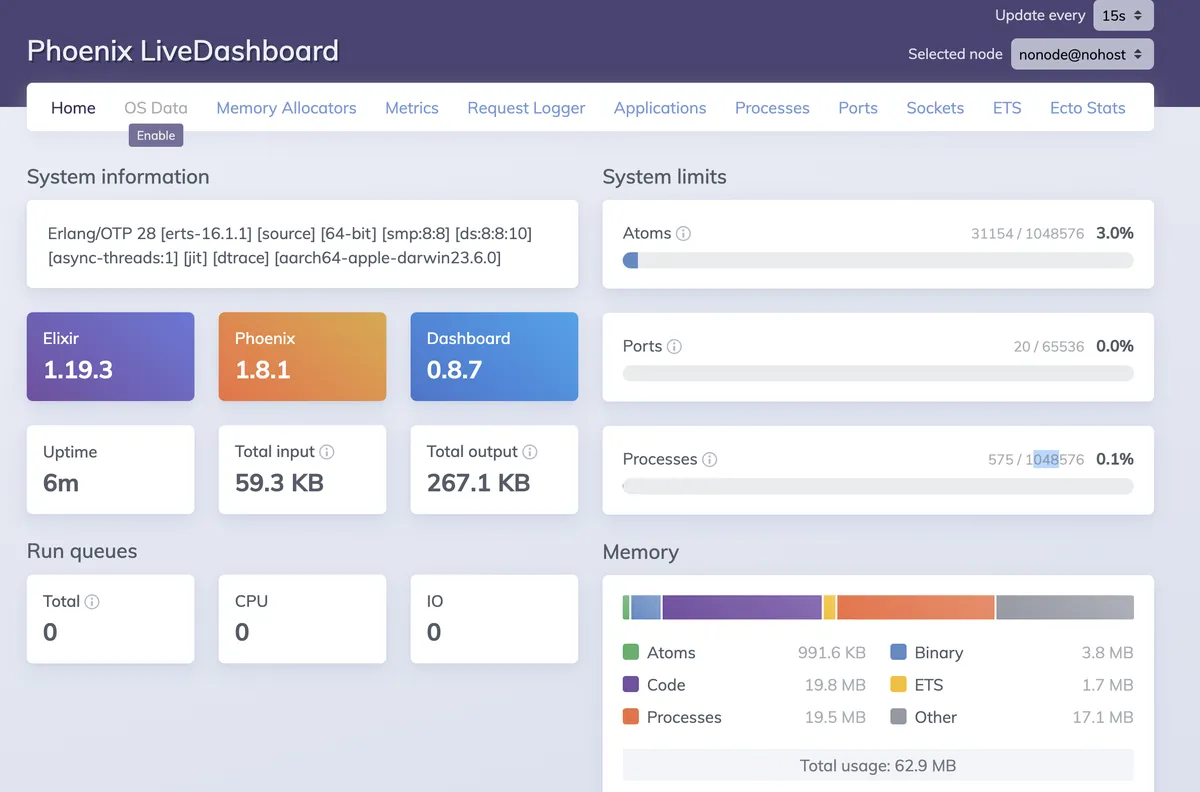
Nice, but it's just a landing page. Handily, phoenix gives us a bit more - there's a very detailed developer dashboard at dev/dashboard:
The cool part is that there's an extension mechanism built into it. You just need to add a dependency on your add-in ({:ecsx_live_dashboard, "~> 0.1"}, in this case), to the deps/0 function in mix.esx and insert the code below into router.esx:
  scope "/dev" do
      pipe_through :browser
      live_dashboard "/dashboard", metrics: TaiichiWeb.Telemetry,
        additional_pages: [
          ecsx: ECSx.LiveDashboard.Page
        ]
      forward "/mailbox", Plug.Swoosh.MailboxPreview
    end
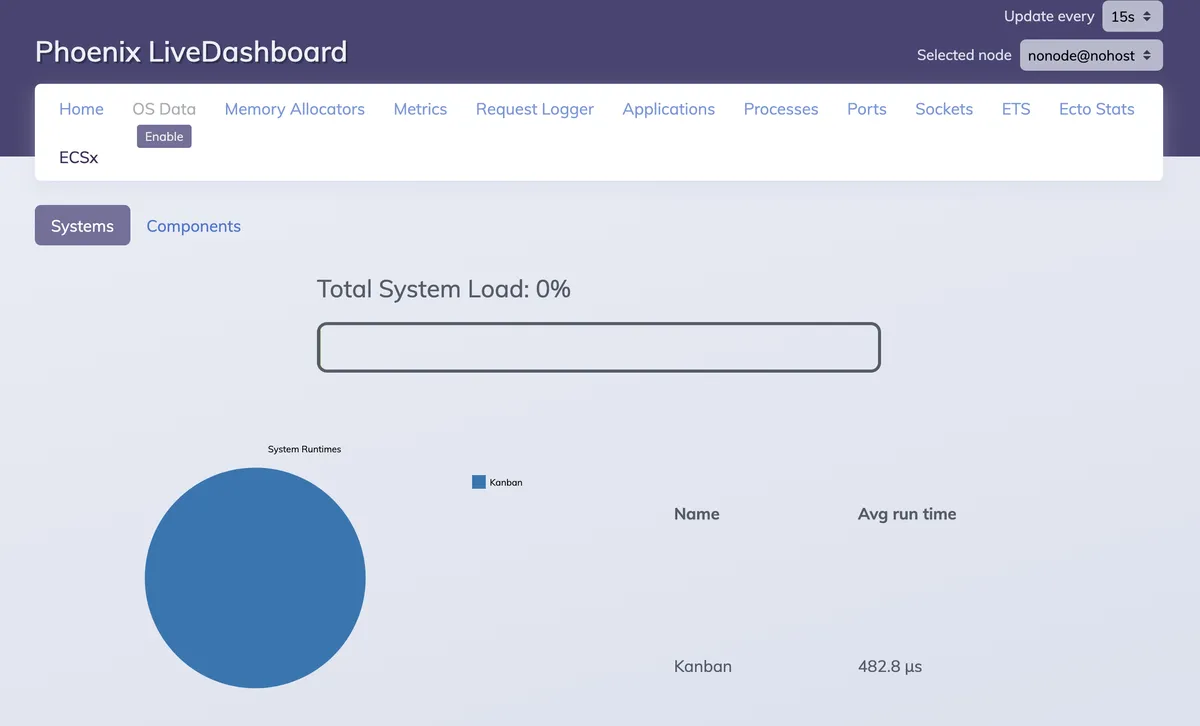
Hurrah! We can see our Kanban system is there, taking not quite half a millisecond to do its thing! Yeah, the layout could use some love, but it's only version 0.1 according to the dependency we added to mix.esx.
Next time - let's add a Product Owner to our Kanban system.
Other posts in this series: